
Gantt Charts
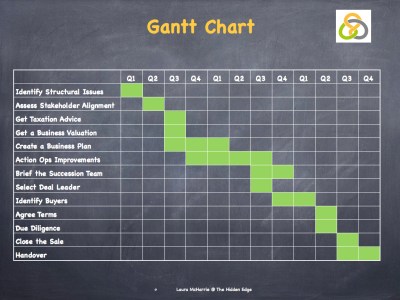
A Gantt Chart is one where a series of horizontal lines represents the amount of work to be completed in a certain period of time. It is most commonly used in project management activities that have a defined end point. The concept is named after Henry Gantt, who worked on time and motion studies in business development. It was adopted during the first world war by the USA to manage the war initiatives.
Feel free to request the templates laura@thehiddenedge.co.uk. I am happy to share.
1. Recognise the elements of a Gantt Chart
2. Gather a focus group to brainstorm the activities needed in a project.
3. Write each on a post it note and assemble in a time linear form
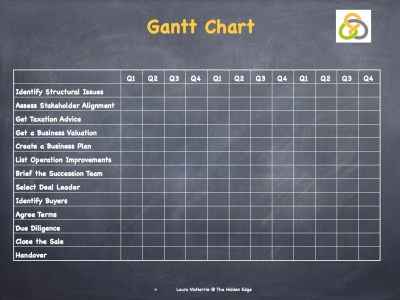
4. Assess the time to complete each aspect of the project
5. Illustrate timeline in a Gantt Chart for all those involved in the project can access.
Please do share your experiences with these models in the comments below. I am building a portfolio of small business case studies and would love to include examples of what has worked well for you.
PS – If you need further help then give me a call on 07962 626604 to arrange a Skype session with me.
See My Profile on LinkedIn
![]()
